Overview
The INOWISE.IO dashboard provides real-time monitoring and management of distributed assets across multiple locations. It allows operators to track machine status, live sensor readings, and event alerts — from a global map view down to individual device telemetry.
Dashboard & Map Navigation
The primary interface provides high-level oversight and spatial tracking of assets across global and local environments.
Zoomable Map View
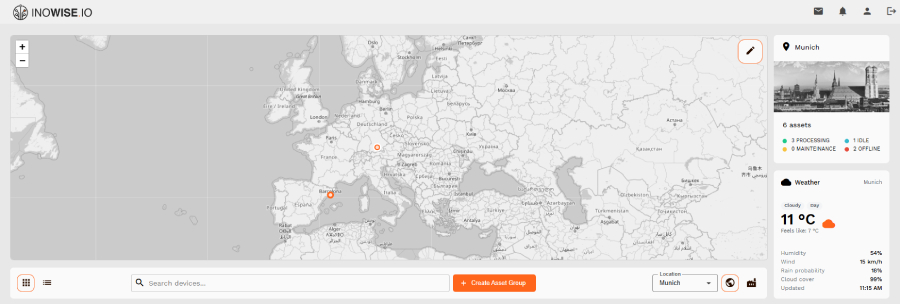
An interactive global map displays all machine locations, enabling real-time spatial awareness of distributed assets.
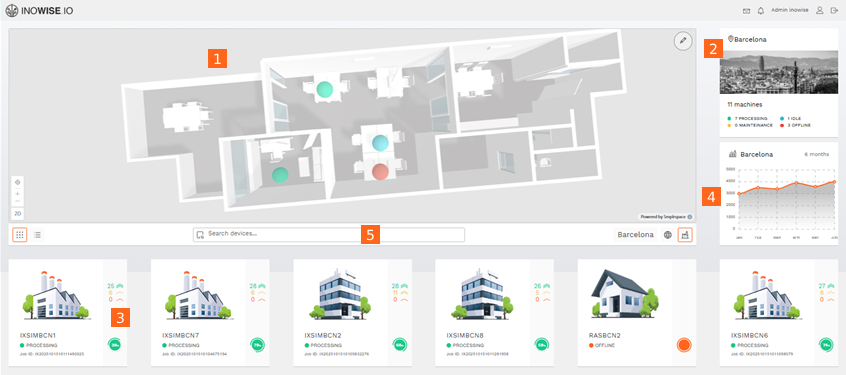
Building-Level Visualization [1]
The system supports transitioning from a world map into a 3D-style interior layout to visualize assets within a specific building or room.
Location Quick Overview [2]
A contextual sidebar for the selected location (e.g., Barcelona) provides an operational snapshot, including status and key metrics.
Machine Status Overview [3]
Machines are categorized by operational state:
- Processing (Green)
- Maintenance (Yellow)
- Idle (Blue)
- Offline (Red)
Regional Statistics [4]
A 6-month time-series line graph displays performance or sensor activity trends for the selected location.
Search & Filtering [5]
Users can search for specific devices and switch between grid and list views for asset exploration.
Machine-Specific Telemetry & Monitoring
Drilling down into a single asset provides detailed real-time and historical operational data.
Live Sensor Information
Real-time readings from key sensors:
- Temperature
- Humidity
- Air pollution levels
- Gas concentration (CO₂)
Operational Progress
Circular progress indicators show job completion status (e.g., 14%, 36%).
Event Logging (Messages Tab)
Structured event table including:
- Event ID
- Severity (color-coded)
- Timestamp (UTC)
- Job ID
- Description (e.g., "High temperature", "Job started")
Visual Statistics (History Tab)
Historical line charts showing sensor behavior over time for trend analysis and anomaly detection.
System Hierarchy (Data Architecture)
A structured five-tier hierarchy enables scalable asset management and telemetry aggregation.
Customer
Top-level entity representing the organization or client.
Location
Geographical hubs (e.g., Barcelona, Munich, Milan).
Asset Group
Functional grouping of assets within a location (e.g., Building, Factory, Bridge).
Asset
Physical entities being monitored (e.g., Printer, Desk, Pipe, Flow Meter).
Devices & Sensors
Hardware and measurement layer attached to assets:
- Devices: Physical data-collection units
- Sensors: Individual measurement channels (Temperature, Humidity, CO₂, Power)
Each sensor generates time-series telemetry used for monitoring, analytics, and alerting.